As a copywriter, when I write a copy for a website, I always ask myself a question.
Does the audience relate to this copy? Have I conveyed my value?
Is there something in my copy that is off-putting?
The heatmaps tools, like the click maps tool in FigPii, can give us an answer.
If it does not go as we expect, it might tell us why people behave this way.
But before we jump into how you can use heatmaps to help you improve your website and its content, let me give you a quick introduction to heatmaps.
Scale insightful marketing content across the web.
We help you grow through expertise, strategy, and the best content on the web.
What are heatmaps?
A website heat map is a visual representation of the visitor interaction shown in a map where differently colored points on the map represent different data sets.
Website heatmap tools capture visitor clicks and movement, scroll depth for all devices in one report.
Heatmaps are great for figuring out which section of a page has the highest visitor engagement, where visitors are clicking the most, whether they are clicking an element, whether they reach the bottom of the fold and many other insightful aspects of their behavior.
Heatmaps are used to show us how much activity is all over our website.
We can use heatmaps to tell us where people click, scroll or focus on a webpage.
It helps us understand what our audience wants to know about before they leave.
Heatmaps can be used to tell us what’s confusing, what they want more of, and even where there are gaps in the story.
On a heatmap, colors indicate activity level.
The data is extracted from heatmaps by using heatmap software such as Attentioninsight, CrazyEgg or FigPii.
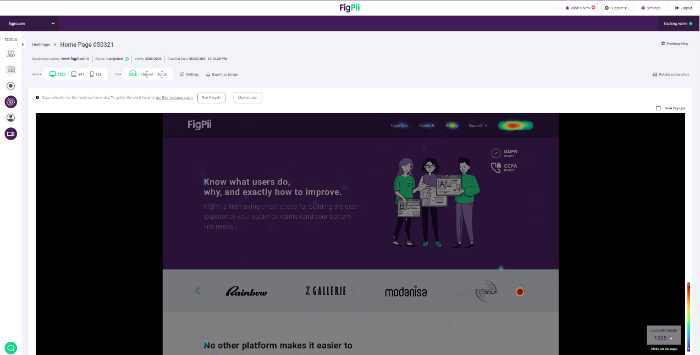
So if you use any of those tools to collect heatmap data for your website, then the heat map report will look something like this:

As we can see from the heat map above, most people click “Request Demo.”
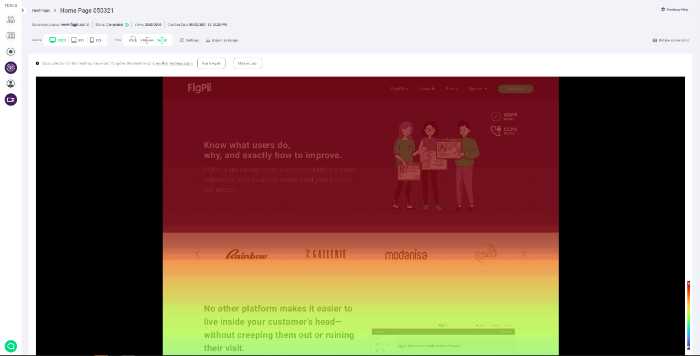
But when it comes to content, you can see that above the fold is where most people land and read.
So you need to deliver your most engaging content first thing; a catchy headline will do the trick.

Why are heatmaps important for your website?
Heatmaps are a very effective tool to use when you want to improve the copy of your website or its flow.
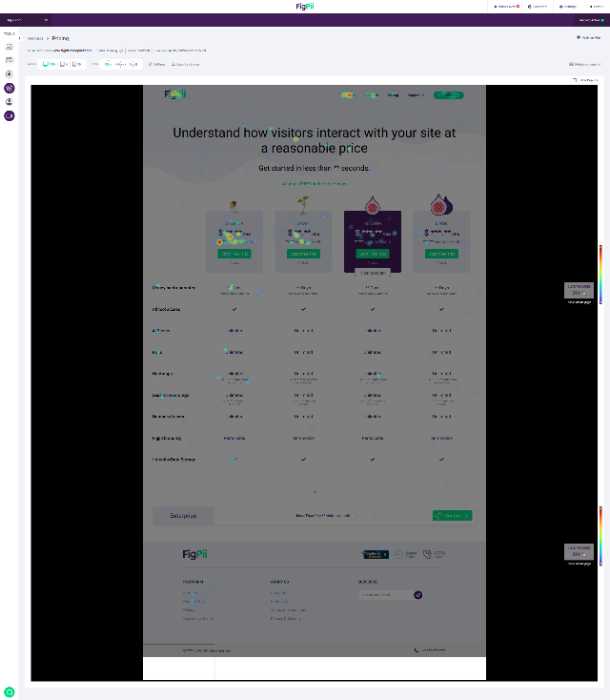
This heatmap below was taken by this heatmap tool. It can help us see how people move around that page.
That heatmap can help us a lot in terms of navigation and website flow.
It can also tell you about the length of your copy.
If most people get bored after 2 minutes, maybe it is time to break that text into smaller chunks or turn it into an infographic?
Heatmaps are a handy tool if you have B2B products or services. It’s perfect for any kind of business selling anything online.
But heat maps not only apply to B2B businesses; any eCommerce site can benefit from heatmaps too!

What can heatmap tools tell you about your website?
Heatmaps can help you identify what’s working and what’s not.
How visitors are behaving on your website and what you can do to improve the flow of information on that page.
Heatmap tools such as CrazyEgg or Figpii are a great way to understand how people use your website.
They can help you identify conversion opportunities and where do your visitors drop out. For example, Infinity Dish is a TV package provider, they can monitor which of the different packages receive the most interest from site visitors and thus find opportunities and offers.
Heatmaps can help you figure out where to place the call-to-action (CTA), how long people are staying on that landing page, and what they do after this CTA.
Another great advantage heatmaps offer is that they allow you to see how long visitors stay on each section to deliver relevant content for them.
They help us understand where visitor attention drops off in a case where there’s not enough information or something is confusing them.
You get to know our audience better by getting their feedback through heatmap reports, indicating where they find it difficult to read or find important elements.
That will help you figure out how to improve your writing style for engaging with your audience.
Now heatmaps are a very useful tool for content marketers and website owners alike to tell where they need to focus attention, but how can you use heatmap reports?
Here are some great ways you can use heat maps:
Increase site usability: You want your visitors to have a good experience on your website. You want them to click around and stay on the page.
Heatmaps show you where your visitors pause or leave your site altogether.
Either way, heatmap reports will give you insights into what’s working on your site and what needs improvement.
Optimize for conversion: Based on heatmaps, you can optimize your website for conversions.
It will help you figure out where people click most often and try to increase it without pushing away visitors that came there with a different purpose in mind.
Understand your audience: If you want your customers to keep coming back for more, then heatmaps can help you understand them better.
Focus on the positive: We have already talked about heatmap reports helping you identify conversion issues, but they can also highlight what’s working as well.
If your heatmap report shows high traffic to one section of the page, you should put more focus there on other pages or even on a different location.
Improve graphics: You might not realize that images and photos are an integral part of writing a good headline or interesting wordings.
That’s why heat map tools help us see how “eye-catching” our articles are by tracking where people look at first, i.e., where they see eye candy (i mean images).
Within heatmap reports, you’ll find a heatmap overlay that shows how users clicked around certain areas on the page by mouse movements.
Every pixel in this heat map is clickable to see more data.
This heat map can help you identify anomalies or pages that aren’t getting enough attention from your visitors.
What can heatmap tools tell you about your copy?
It also allows you to compare different parts of your website with each other.
For example, let’s say you have two different versions of the same article, where one has a video embedded and another.
Using heatmap tools, you can see heat patterns and clicks and understand why people behave the way they do on your website.
After heatmap tools, we can examine heat patterns to see that:
1. People are not landing at our CTA (Call to Action) area or guides them away;
2. People are missing particular information and require additional details about products/services;
3. We need to make them spend more time on a page before asking for an action.
Key Takeaway – Heatmap tools tell you what your audience is thinking and how they want to interact with your content differently.
Use heat map tools as an experiment to learn more about your visitors’ behavior and improve your copy and design accordingly.
Long blogs vs. short blogs
Now here’s a great question only a heatmap can help you answer.
Do you write a long blog post to help its chances of ranking higher?
Or do you write a short blog post that packs all the info for your user with a CTA at the end to boost conversions?
Your heatmaps will tell you which one is the better option for your audience.
It’ll also show how long people stay on a page and at what points they leave it, so you can then take this information and decide if you need to tweak anything in your article or not.
Using heatmaps, you can see if visitors to your website read the article from start to finish or scan through it and jump straight to a certain part.
And with proper traffic and analysis, you can find that people are interested in a certain area of your product.
That discovery is a great key to help you write consumer-driven content, not just output content to rank higher.
Key Takeaway – Use heatmaps to find out if short blogs or long blogs are the better option for your audience and then write heatmap-friendly articles.
Parting words for heatmap tools
Now that you have seen some heat maps in action, it’s time to get down to business and use heatmap tools on your website!
A heat map report helps you understand where people look first, what they like reading the most, what content isn’t getting enough attention and other important conversion factors.
Heatmaps help you diagnose issues related to the design, navigation, readability, and overall user experience of your website and article/post.
This is a great way to improve conversions as well as the quality of the post itself.
Conclusion
Heat maps are an awesome tool that every marketer should be taking advantage of.
Take heatmap heat patterns to identify “problem spots” on your website or article and make changes accordingly.
If you’re still not using heatmap tools, then I highly recommend you start!
Using heatmaps, you can identify major conversion pitfalls and cracks in your funnel that your users are falling through.
Heat maps can tell you a lot about your website, how users find it, and if they’re leaving it too early.
Not only your website but heat maps can also help you produce better content.
By analyzing your heatmap report, you can identify if your users are reading your blog posts or not.
So if you’re looking to improve your website and its content, you should be looking at installing a heatmap tool to help you understand your visitors better!


