


In this article
You’re consistently coming up with interesting blog post ideas, creating SEO-optimized content, and promoting it across your channels. In spite of doing everything by the book, something’s not right — your blog’s not getting enough traffic.
Want different results? Do things differently.
How about using infographics to drive traffic to your blog?
Being a combination of visuals and minimal text, infographics are useful for making complex information easier to understand. They have the power to capture attention, engage readers, and communicate information more effectively. You don’t have to scratch your head much in designing one. Infographic maker online lets anyone design eye-catchy infographics in minutes.
Not only do they attract more views and shares but they also help boost website traffic by 12%.
Here’s how you can include infographics in your content marketing strategy and use them to boost blog traffic.
Scale insightful marketing content across the web.
We help you grow through expertise, strategy, and the best content on the web.
1. Find an interesting topic
Infographics have the potential to be your ticket to blog traffic but that doesn’t mean creating one for the sake of it is going to help you reach that goal.
What’s important is creating a good infographic that generates interest and captivates your audience.
The first step is to find an interesting topic for your infographic. It needs to be one that’s relevant to your audience and focused on a specific goal or pain point.
Here are some tactics to come up with creative infographic ideas:
- Do market research and present your findings
- Survey your audience to solve a pain point
- Challenge conventions and debunk myths
- Do a deep-dive into industry trends
- Use tools such as Google Trends and BuzzSumo to find trending topics to piggyback on
- Repurpose a well-performing blog post
- Crowdsource expert opinions
Finding the right topic is a crucial first step and will decide the success of your infographic.
Here’s an informative infographic created by John Hopkins Medicine. They published this at the onset of the coronavirus pandemic to educate people about the disease. It’s a topical topic and manages to instantly pique interest.

2. Design a compelling infographic
While doing research and planning the infographic content is one half of the story, the other half is designing it. You can present the most unique insights but if your design falls flat, there’s no way it’s going to keep your readers engaged.
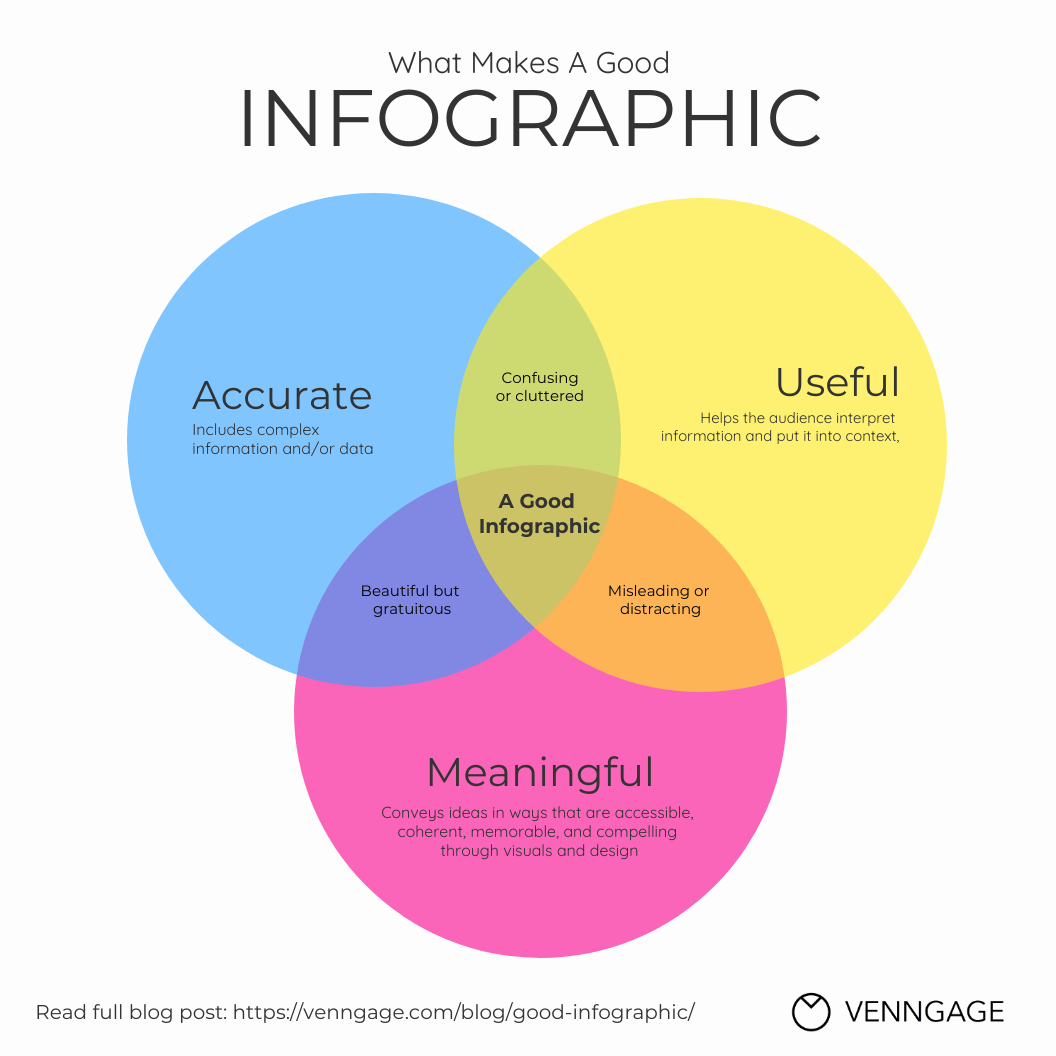
Infographics are highly visual — the trick lies in finding the right balance between aesthetics and function. This means your infographic needs to be visually appealing and effective in communicating the information without misleading or distracting readers.
If you’re not a designer, the thought of designing an infographic might seem intimidating but you can always use ready-made infographic templates or visually appealing presentation templates to get a head start.
Here are some design tips to help you create a beautiful infographic:
- Plan the flow of the information
- Use a grid layout or wireframe to structure your infographic
- Select the right infographic layout for your data
- Stick to 2-3 legible fonts
- Decide on a color scheme and don’t use more than 3 colors
- Use original images, icons, and illustrations to strengthen the communication
- Include design elements such as arrows, shapes, lines, and borders to highlight, organize, or group related information
- Make sure there’s enough white space between all the design elements
Here’s an example of a simple, well-designed infographic. It uses descriptive headers, illustrative icons, and arrows to present the information effectively.

3. Make the infographic easy-to-share
There is no greater joy for a content marketer than to see their content getting shared. After all the effort that you put into planning and designing the infographic, you want people to read and share it on their platforms.
Once your infographic is ready, make sure you create an embed code for it. An embed code is a block of HTML text. People can paste this embed code and share the infographic on their website.
What’s more, the embedded infographic will automatically link to your website, helping you build links and drive blog traffic.
You can use Siege Media’s Embed Code Generator to generate this code.
It’s also a good idea to add social sharing buttons alongside the infographic so that people can share it on their social media platforms with a click of a button.

4. Publish mini-infographics on social media
Infographics receive 3x more shares than any other type of content on social media.
The question is: how do you share infographics on social media?
Considering the length and dimensions of infographics, it’s not a wise idea to publish it as-is on social media because you’re likely to be left with a cropped visual — and that’s not going to get you the shares or clicks.
Look at this LinkedIn post, for instance. It’s difficult to make sense of the infographic unless you click on the image and zoom in to read what’s written.

While you can share the link to your infographic like how Salesforce does it below..

..a smarter way to share infographics on social media platforms (and attract traffic) is to break them down into mini-infographics.
Mini-infographics are a type of snackable content and work well for social media because they are designed for quick, simple, and flexible consumption.
Publishing mini-infographics (with a link to the whole infographic on your blog) will help you give people a glimpse of it while making them click on the link and want to know more.
You can design a striking teaser post or even pick out key statistics from the infographic and post them as a carousel or multi-image post on Facebook, Twitter, LinkedIn, or Instagram.
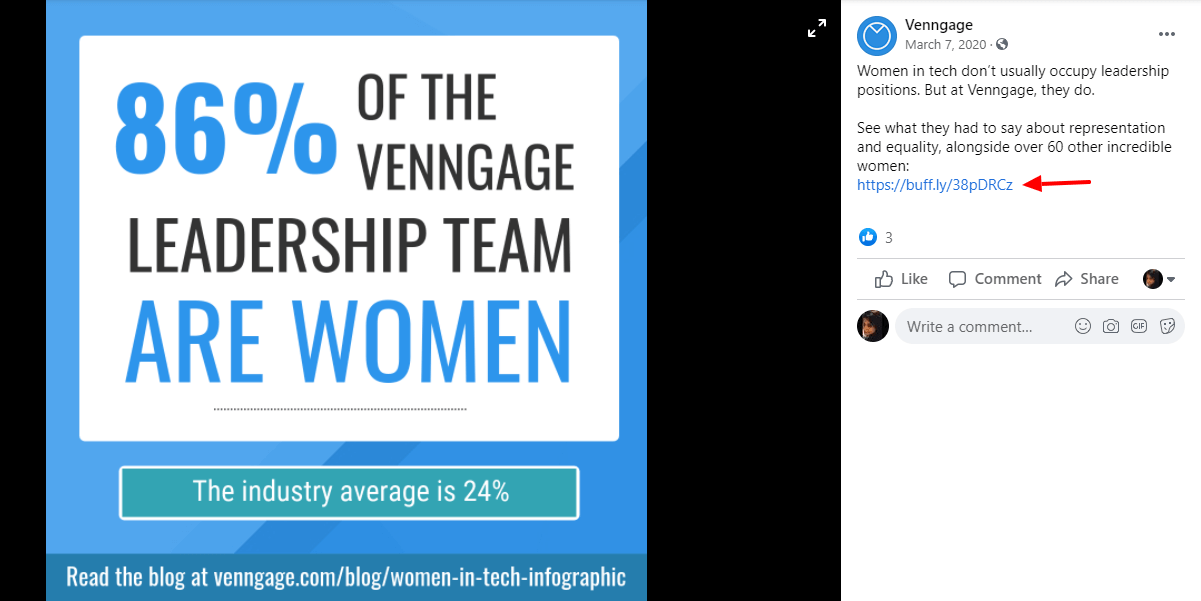
Here’s an example of a mini-infographic Venngage shared on Facebook. Notice how it focuses on one statistic (statistical infographics are a thing!) and includes the link to the main infographic in the caption.
5. Share the infographic with your email subscribers
Whether it’s a new blog post, eBook, whitepaper, or webinar — email is one of the first distribution platforms marketers turn to, and rightly so.
The same holds true for promoting infographics and driving traffic to your blog.
But don’t make the mistake of sharing the entire infographic in the email newsletter because if you do that, you won’t be giving your subscribers any reason to visit your website.
A good tactic is to share an interesting snippet from the infographic in the email body to generate interest. You should place a call-to-action such as ‘View Infographic’ or ‘Download the Infographic’, encouraging people to click on it and get directed to your blog.
Here’s a snippet from Litmus’ email newsletter. They’ve shared a few highlights from the infographic and included a call-to-action that directs people to their website.

6. Pitch bloggers and influencers
Social media and email marketing are great ways to promote your infographic, attract clicks, and drive traffic to your blog.
But let’s go one step further — think beyond your community and see how you can leverage the popularity of bloggers and influencers in your niche to reach a new set of audiences.
Start with making a list of websites in your niche that speak to a similar target audience and would be interested in your infographic. The idea is to get them to share your infographic and have it link back to your blog, thereby boosting blog traffic.
Here are the two types of collaborations you can suggest in your pitch email:
a. Pitch the infographic to them and offer to provide an exclusive supporting copy.
b. Use the guestographic method where you partner with a website to create a unique infographic from scratch.
This is an example of a guestographic Venngage created for HubSpot.

7. Promote it in online communities
From Quora and Reddit to Slack communities and social media groups, people are perennially looking for answers to questions. What if you could pitch your infographic to be the answer?
Browse forums and online communities to learn more about the conversations surrounding the topic of your infographic.
For instance, if your infographic is about vegan myths. You can search for conversations surrounding vegans or vegan diets and engage with people in those communities.
Don’t just leave a link to your infographic. Draft well-researched, thoughtful responses that establish your expertise in the domain, and then use that medium to also share the link to your infographic.
This is a good way to provide value and build connections while expanding your reach.
The takeaway: Increase blog traffic with infographics
If you’re worried about not getting enough traffic, it might be time to bring infographics into the mix.
Even if it seems like a little more work, creating and promoting infographics has long-term benefits. These seven tactics will help you use infographics to attract clicks, drive traffic to your blog, and engage your readers.